H817 – Block 2 – Activity 23 – Visitors and Residents map
Create a Visitors and Residents map for yourself, considering the technologies you use (e.g. email, VLE, blog, Facebook, Skype, Google, etc.), using the personal/institutional axis as well as the visitors/resident one. There is not a definitive list of technologies, you should include any technologies you use regularly (for example, if you are a keen user of Flickr, add that). You can use a tool such as Word, or Powerpoint to create the grid, or a drawing package if you have one.
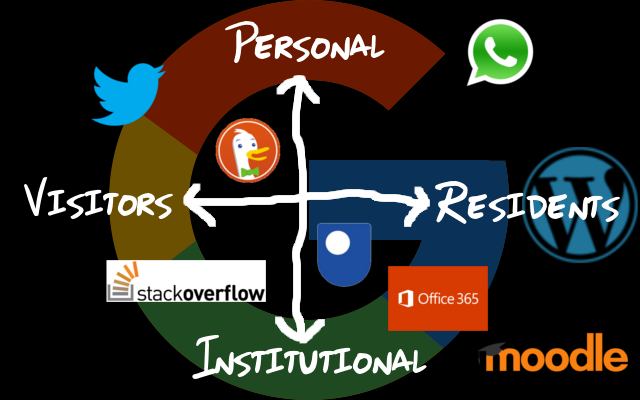
I felt Google so all-encompassing (Youtube, Search, Classroom) that I made it the background motif reaching all four corners of my grid. I grouped applications such as Teams, OneNote, etc in the 365 suite to save space. They are all fairly well contained within the Institutional Resident part of my grid anyway. I am ashamed to say I visit Stack Overflow to take rather than share. If you are not aware the duck is the DuckDuckGo browser/search engine which I often use to conduct searches (such as checking medical symptoms) which I would not want Google to be storing for me. WhatsApp represents itself and Facetime which I use to connect with friends and family. WordPress is part of my job and personal life so that crosses over the personal institutional axis.