H817 – 20b – Block 4 – Week 23 Activity 14 – Network Diagrams – PART 1
Read this short paper that provides an introduction to social network visualisations and to the SNAPP tool:
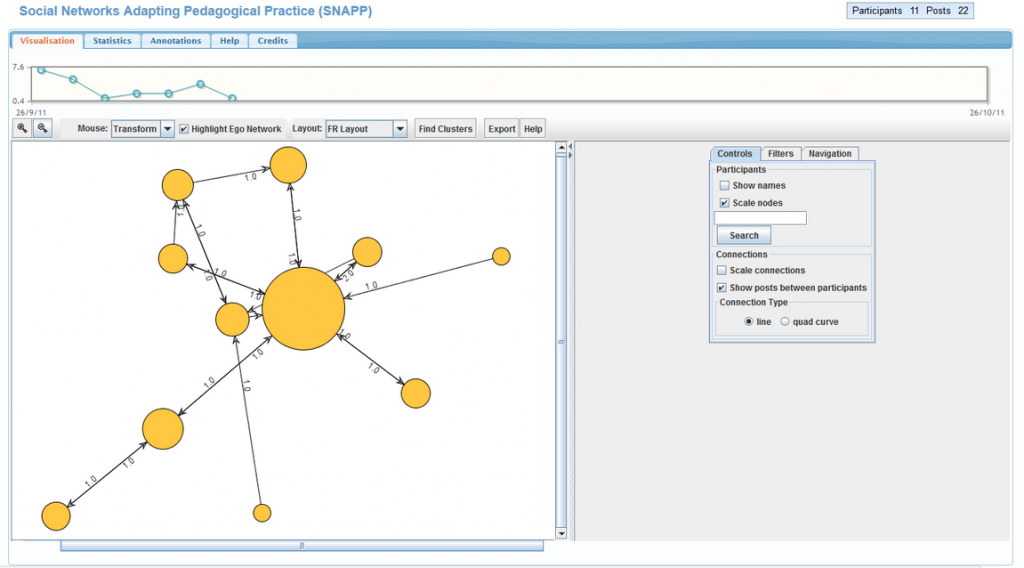
Bakharia et al. (2009), Social networks adapting pedagogical practice: SNAPP.
In your learning journal, or blog, make a note of the things that can be revealed by a network diagram of students’ discussions. The authors identify six – you may be able to think of more. Use these as headings and, under each one, note how this information could be used to support learning and/or teaching in a group. Also note any potential problems, and how these might be addressed.
• Identify key information brokers within a class
This information is useful to identify those holding knowledge of the subject matter being discussed within and between groups of students. Certain members of the discussion become key to the flow of information due to specialism or prior knowledge. These individuals are described as ‘gatekeepers’ by Marczak et al. (2008). Although focussed on individuals communicating between teams the same principle could be applied within a class group.
• Identify disconnected (at risk) students
This may help to identify students who are left out of the discussion or who rarely take part. The tutor could use this information to encourage other students to respond to the at risk student to help them to integrate into the group. This may be problematic if the student’s peers do not want to engage with them or if they are not interested in the particular topic at hand.
If some students attract a lot of attention in a discussion this could alienate others. Being left out may harm their chances of succeeding.
• Identify potentially high and low performing students so teachers can better plan learning interventions
Students may not be aware of the expectations for their involvement in the group discussion.
They may also may have commitments/ time pressures which prevent them from playing a full part in discussions at certain times. Those students who perform poorly in certain areas may not have as a first language that of the discussion. There may be motivational problems with the discussion matter.
• Indicate the extent to which a learning community is developing within a class
This information may identify groups of friends who tend to communicate among themselves. This was studied by Leskovec et al. (2012) revealing user’s social circles using their social media interactions. This could help the tutor identify students who may need help to integrate into the group. A lack of interaction between the participants may indicate that they are tending to work alone or are not identifying a benefit from the activity.
• Provide a “before and after” snapshot of the various interactions occurring pre and post learning interventions. (This diagrammatic representation is also a useful indicator of reflective teaching practice e.g. through integration with teaching portfolio artefacts)
A before and after representation of a learning artefact could show that a change in teaching practice has led to an improvement in engagement, interest or motivation from the students. If student ‘turn taking’ has improved this may be an indication of a more free flowing discussion.
• Provide timely opportunity for students to benchmark individual performance and engagement against fellow peers
This type of diagram could provide valuable evidence that a student is participating as an equal within the framework of the discussion. If the nodes occupied by the student are spare or appear only on the fringes of the discussion this could be a useful indicator that they may require to make a change. If the distribution of nodes is dense and connected to a student they could be an ‘ego node’ where they reply to many individuals even if not in a particularly relevant way, or they may by ‘brokers’.
A problem I can suggest for this is that the level of interaction does not show the quality of the interactions so there may be false positives and negatives in the data.
• Reveal the amount of intervention required by the tutor to facilitate discussions
The tutor may be able to use their own nodes in a network diagram to gauge whether their level of prompting is sufficient or overwhelming. Has the discussion become a stalemate ? Is there a rich discussion taking place without any prompting?
REFERENCES:
Bakharia, A., Heathcote, E. and Dawson, S. (2009) ‘Social networks adapting pedagogical practice: SNAPP’ in Atkinson, R.J. and McBeath, C. (eds) Same Places, Different Spaces, Proceedings ascilite 2009, 26th Annual ascilite International Conference, Auckland 6–9 December 2009, Auckland, The University of Auckland, Auckland University of Technology and Australasian Society for Computers in Learning in Tertiary Education (ascilite) [Online]. Available at https://pdfs.semanticscholar.org/ e760/ 2db93a6c026570fb49b42ae2bc3c9691a043.pdf (Accessed 13th July 2020)
Leskovec, J. and Mcauley, J.J., 2012. Learning to discover social circles in ego networks. In Advances in neural information processing systems (pp. 539-547).
Marczak, S., Damian, D., Stege, U. and Schröter, A., 2008, September. Information brokers in requirement-dependency social networks. In 2008 16th IEEE International Requirements Engineering Conference (pp. 53-62). IEEE.