Munin Plugin to Monitor Raspberry Pis
We have various digital signage screens around the college. These have run all manner of solutions such as Display Monkey, OneLan and others in the past.
To allow these to be managed in the same way (if not in the same screen!) we have switched them all over to Raspberry Pi 3B+ units running the community edition of Screenly (OSE).
As the screens are often in areas where no hard wiring is available we rely on Wifi to connect to the Pis. If there’s an issue with Wifi we can no longer change the schedules or upload new content. We often don’t know this until we need to.
I wrote a quick shell script which simply pings every Pi in turn to keep their Wifi connections awake. This is ok but there’s no feedback if something breaks.
I decided to create a Munin plugin as I use Munin to monitor lots of other machines already.
Following the instructions on Munin’s own guide it looked straightforward enough to create a plugin to read a single value.
I chose to use BASH since I know more about that than PERL (the preferred scripting language for Munin plugins)!
The basic configuration for the Munin plugin is:
#!/bin/sh
#
# SCREENLY PLUGIN TO MONITOR CONDITION OF PING
# FOR RASPBERRY PI COMPUTERS
#
case $1 in
   config)
        cat <<'EOM'
graph_title Screenly Pis Ping
graph_args --upper-limit 1 -l 0
graph_vlabel Ping
graph_scale no
graph_category screenly
The important items are graph_title which describes the purpose of the graph, graph_args shows the upper limit of the graph as 10 with a low of 0 (more on this later). The vertical axis is labelled Ping and a new category is thrust upon the munin server.
The next part of the config deals with the label to be shown for each Pi, the critical value (more later) and the closing statement for the case statement is provided.
dfscabinet.label DFS Display Cabinet
dfscabinet.critical 0
hdwallmount.label HDB Wallmount
hdwallmount.critical 0
hdvideowall.label HDB Big Screen
hdvideowall.critical 0
hdreception.label HDB Reception
hdreception.critical 0
dumfriesdoor.label DFS Front Door
dumfriesdoor.critical 0
dumfriesrecp.label DFS Reception
dumfriesrecp.critical 0
dumfriespoint.label DFS The Point
dumfriespoint.critical 0

EOM
        exit 0;;
esac
Munin needs to receive information that a Pi is responding to a ping or not like this:
printf "dfscabinet.value "
if n=$(ping -c 2 CABINET_IP_ADDRESS | grep "errors");then
    echo 0
else
   echo 1
fi
The .value part is important as this is how Munin will separate the returning values.
This is fine for one Raspberry Pi. However I am dealing with 7. I have therefore assigned a specific value to each 1 – 7
This helps to keep each Pi separate on the output graph (truncated):
printf "hdwallmount.value "
if n=$(ping -c 2 HD_WALLM_IP_ADDRESS | grep "errors");then
    echo 0
else
   echo 2
fi

printf "hdvideowall.value "
if n=$(ping -c 2 HD_VWALL_IP_ADDRESS | grep "errors");then
    echo 0
else
   echo 3
fi
...
When the plugin is complete it needs to be made executable and linked into the plugins folder on the Munin Client
$ sudo chmod +x /usr/share/munin/plugins/screenly
$ sudo ln -s /usr/share/munin/plugins/screenly /etc/munin/plugins/
The munin node then needs to be restart and then patience is required until the new charts appear.
The final graph looks like this:
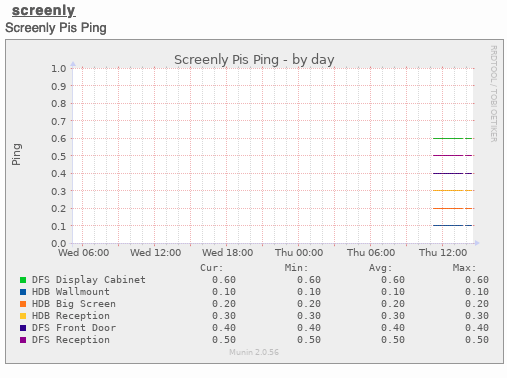
If any of the Pis do not respond to a ping they will show a value of 0, marked as critical in the plugin configuration. The overview screen in Munin will then show a red heading to draw our attention to a failed ping.